
Mole
- Published time
Introduction#
Running out of disk space is one of those problems that always arrives at the worst moment — usually halfway through a training run. And the frustrating part isn't the cleanup itself, it's that you rarely know where the space went. macOS's built-in storage panel groups everything into vague buckets like "Documents" and "Other," which is exactly the information you don't need.
Mole is a command-line tool that answers that question properly. It gives you an interactive, drill-down view of what's actually consuming your disk, plus a set of commands for cleaning up once you've found the culprit.
This post covers how to install Mole, what its main commands do, and then walks through a real example — tracing 136 GB of home-directory usage down to a single cache folder.
Installing Mole#
Mole is available through Homebrew, so installation is a one-liner:
Copied!brew install mole
That gives you two equivalent commands: mole and the shorter mo. The examples below use mo.
To confirm it installed correctly:
Copied!mo --version
What Mole Can Do#
Running mo on its own opens the main menu. Five commands cover the bulk of what you'll use it for:
| Command | What it does |
|---|---|
mo clean | Free up disk space by clearing caches, logs, and other reclaimable files |
mo uninstall | Remove apps completely, including the support files a drag-to-Trash uninstall leaves behind |
mo optimize | Check and maintain system settings |
mo analyze | Explore disk usage interactively |
mo status | Monitor system health |
Anything destructive supports a --dry-run flag, which shows you what would be removed without touching it. It's worth making that your default the first few times:
Copied!mo clean --dry-run
mo clean and mo optimize also support --whitelist, for marking caches you want protected from cleanup.
Beyond these five, Mole ships a handful of extra utilities — mo purge for removing old project build artifacts, mo installer for tracking down leftover installer files, and mo touchid for enabling Touch ID with sudo.
Walking Through Analyze#
mo analyze is the command worth learning first, because it tells you where to aim everything else. Running it opens a browsable breakdown of your disk:
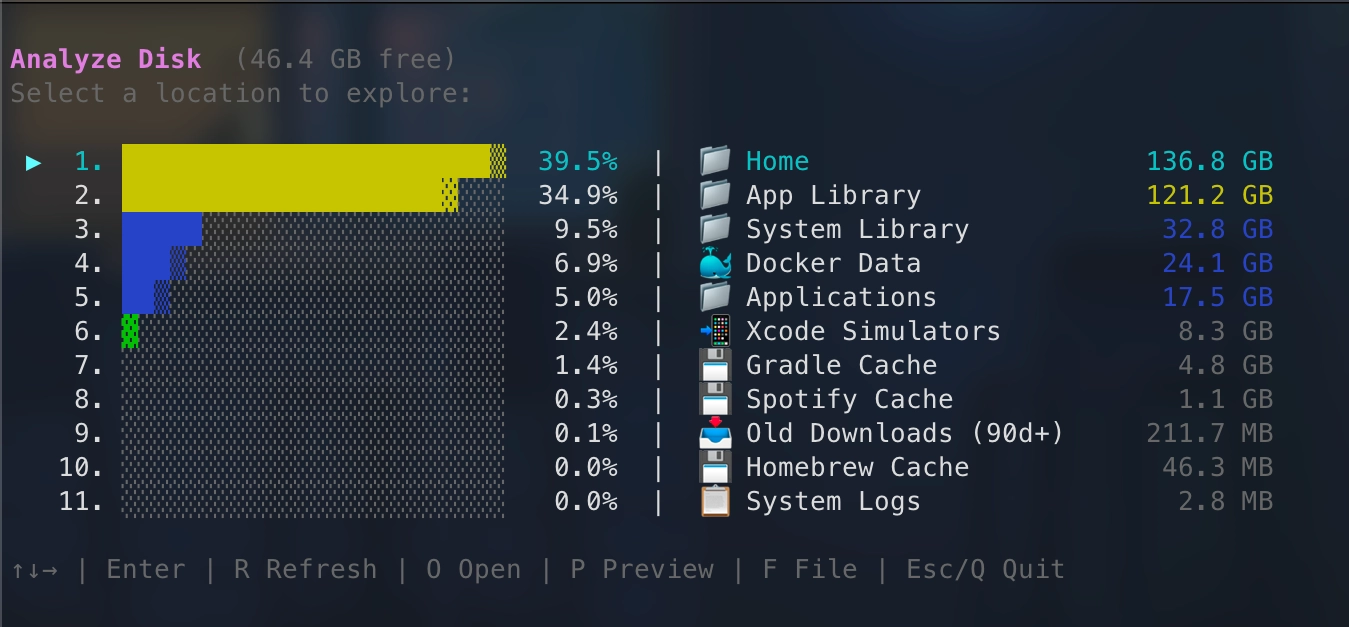
Straight away this is more useful than the built-in storage panel. Home is the biggest consumer at 136.8 GB, App Library follows at 121.2 GB, and Docker Data is sitting on 24.1 GB — with only 46.4 GB free on the disk overall.
The real value is that these entries are navigable. Pressing Enter on Home drills into it:
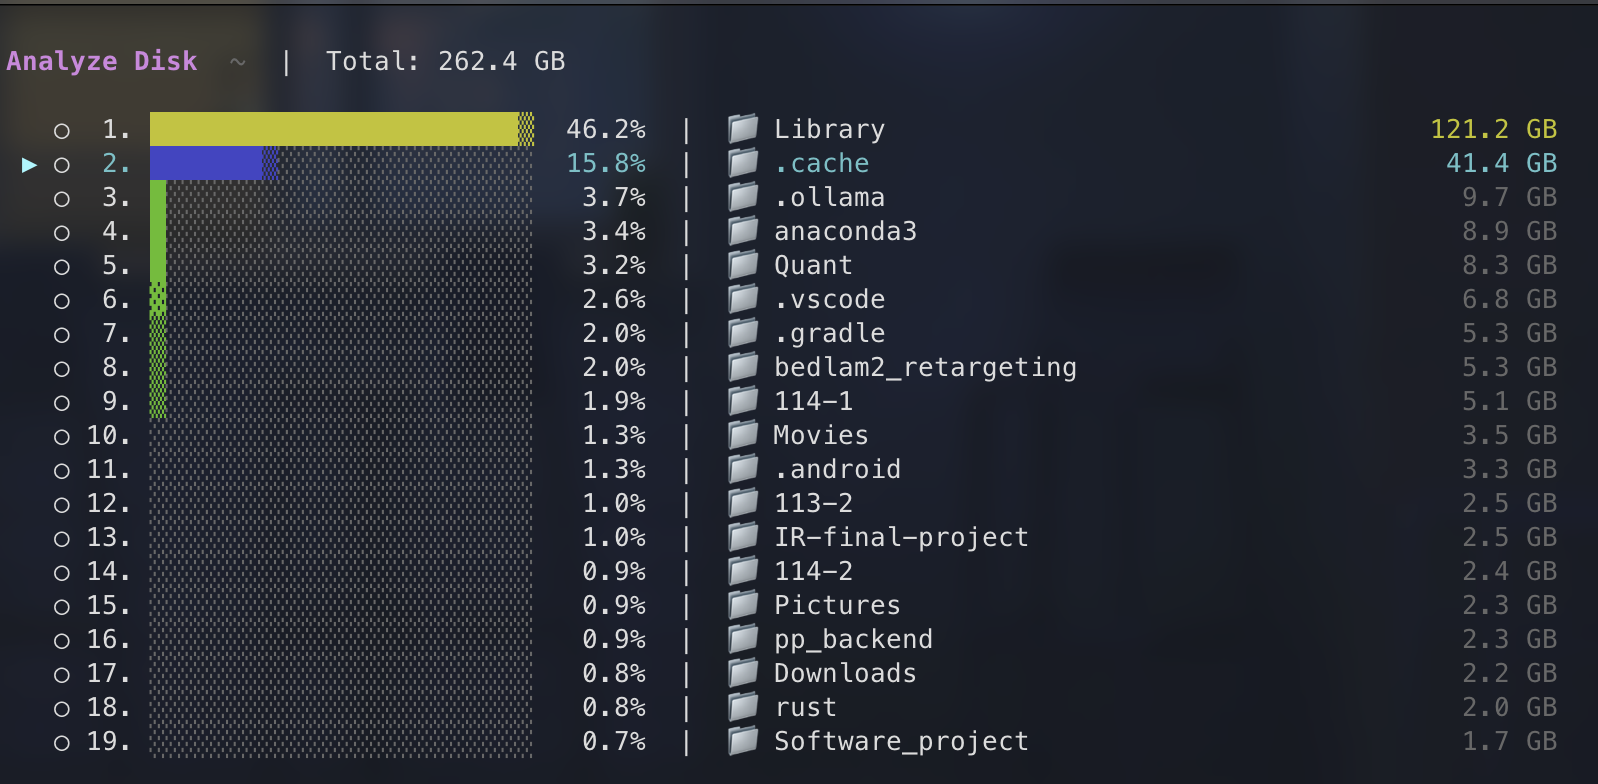
Of the 262.4 GB in the home folder, Library takes the largest share at 121.2 GB, but the interesting entry is the second one: .cache, at 41.4 GB. That's a hidden folder most people never look inside, quietly holding more data than every project directory combined.
Drilling in one more level shows what's actually in there:
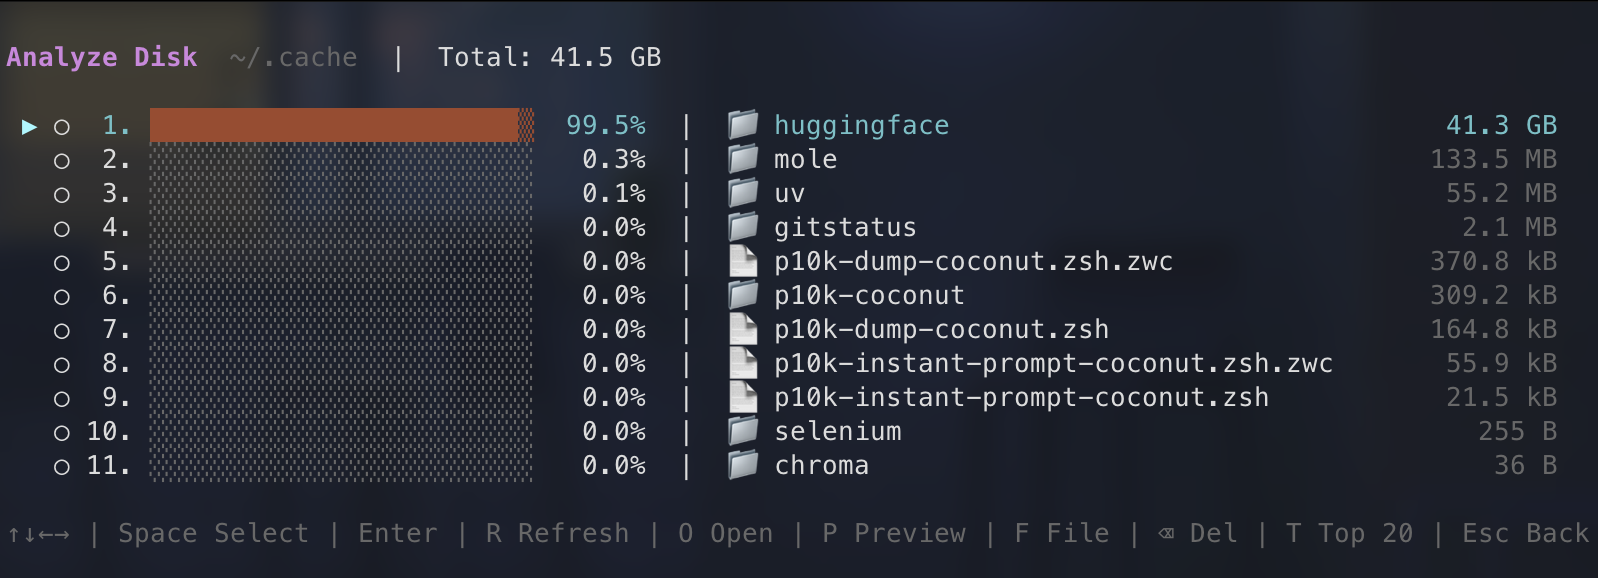
And there it is. Of the 41.5 GB in ~/.cache, the huggingface folder accounts for 41.3 GB — 99.5% of the total. Everything else combined, including Mole's own cache at 133.5 MB, is a rounding error.
This is the pattern worth internalizing: three keystrokes took a vague "my disk is full" into a single folder holding 41 GB.
Cleaning Up the Hugging Face Cache#
The contents of that folder are model weights. Every time you pull a model from the Hub — through transformers, diffusers, or a direct download — the weights are cached locally so they don't need re-downloading. That's good behavior, but nothing ever removes them. Models you tried once for an afternoon are still there months later, and modern checkpoints run to several GB each, so the total climbs fast.
Rather than deleting the directory by hand, use the Hugging Face CLI to prune it:
Copied!hf cache prune
This is safer than rm -rf on the folder, because it understands the cache's internal structure — the blob storage, the symlinked snapshots, and the refs that point at them. Removing files manually can leave the cache in an inconsistent state that confuses later downloads.
Reclaiming Docker Space#
The other consistently large offender is Docker — 24.1 GB in the screenshot above. Docker accumulates idle space for a few reasons that compound over time:
- Stopped containers are not deleted when they exit; they keep their writable layer until explicitly removed.
- Dangling images are left behind every time you rebuild an image with the same tag. The old layers lose their tag but stay on disk.
- The build cache retains intermediate layers from every build, which is what makes rebuilds fast — and what makes the cache grow without bound.
- Unused volumes outlive the containers that created them, since Docker deliberately won't delete data that might still matter.
To reclaim all of it at once:
Copied!docker system prune -a
This removes stopped containers, unused networks, dangling and unreferenced images, and the build cache. Add --volumes to include unused volumes as well — but be deliberate about that flag, since volumes are where persistent data lives, and anything removed is genuinely gone.
For a gentler option that only clears build cache:
Copied!docker builder prune
Wrapping Up#
Hugging Face caches and Docker images are the two things that grow fastest on a machine used for training work, and neither cleans up after itself. Left alone, they'll reliably consume tens of gigabytes.
The habit worth building is running mo analyze every so often — not to clean anything, just to see where the space went. Knowing that ~/.cache/huggingface is holding 41 GB is the hard part; reclaiming it afterwards is a single command.